PROTEIN DATASET
The protein dataset used to derive the potentials is described in [1]. It is derived from an intial set of 1522 high-resolution X-Ray structures of protein chains
with less than 20% pairwise sequence identity, extracted from the PISCES
website [2] (http:/dunbrack.fccc.edu/Guoli/pisces_download.php). From these,
all structures containing more than 5% heteroatoms or non-natural
residues were excluded. The chains with missing residues were divided into
continuous fragments, and only the fragments of 50
residues at least were kept.
This led to a dataset of 1537 fragments from 1403 protein chains.
-
- [1]
Development of novel statistical potentials describing cation-pi
interactions in
proteins and comparison with semiempirical and quantum chemistry
approaches
D. Gilis, C. Biot, E. Buisine, Y. Dehouck and M. Rooman
J. Chem. Inf. Model. (in press)
- [2]
PISCES: recent improvements to a PDB sequence culling server.
Wang G, Dunbrack RL Jr.
Nucleic Acids Res. 2005 Jul 1;33(Web Server issue):W94-8.
[
Top,
Prelude&Fugue
]
PERFORMANCES OF PRELUDE&Fugue
Position score
Prelude&Fugue was applied to predict the structure of each
protein of the dataset, using the jack knife crossvalidation procedure
where the target protein is removed from the dataset when deriving the energy functions.
The percentage of correctly predicted positions for each of the seven
structural states A, C, B, P, G, E, and O, as well as the average score, are given in the table
below. The specificities (sometimes called positive predictive values) are defined as the ratio of the number of correctly predicted
states over the number of predicted states, whereas the sensitivities
correspond to the ratio of the number of correctly predicted
states over the number of observed states.
| | | | | |
| | | | | |
|
| 7 states | | | Specificity
| | | Sensitivity | ||
| | 3 states | | | Specificity | | | Sensitivity
|
|
| A | | | 65% | | | 57% | || | | A or C | | | 68% | | | 69% |
| C | | | 31% | | | 40% | || | |
|
| B | | | 53% | | | 50% | || | | B or P | | | 66% | | | 59% |
| P | | | 39% | | | 32% | || | |
|
| G
| | | 35% | | | 44% | || | | G or E or O | | | 38% | | | 71% |
| E | | | 46% | | | 64% | || | |
| O | | | 7% | | | 13% | || | |
|
| Average | | | 47% | | | 48% | || | | Average | | | 64% | | | 65% | | | |
|
The scores without distinction between the helical conformations A and C,
between the extended states B and P, and between the other conformations G,
E and O, are also given.
These scores must be compared to the corresponding random scores, which, in
the case of
the specificities, are
equal to 47% for the 7 states, and 41% for the 3 states.
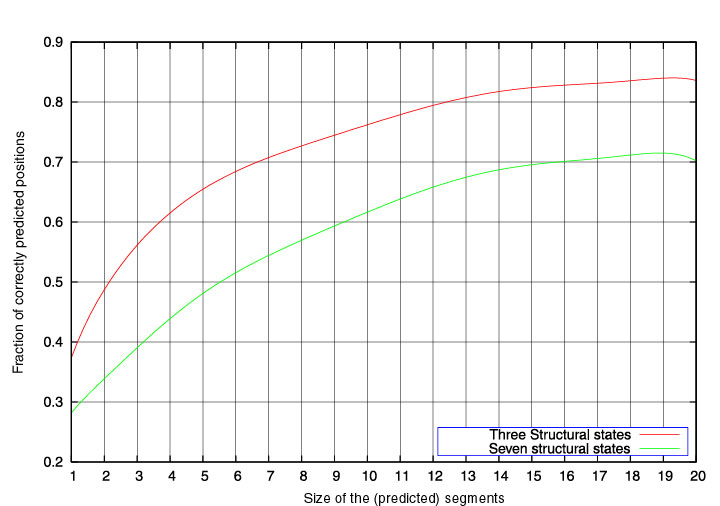
Segment score
The predicted conformations can be divided into segments
corresponding to successions of identical structural states.
The segment score is defined as the fraction of correctly predicted positions
in the
segment. The green curve in the Figure below corresponds to the average segment score as a function of the
segment length. As alpha-helices correspond to successions of A and C states,
and beta-strands to stretches of B and P states, we also define the segment
score for 3 states (A or C), (B or P), or (G or E or O). The red curve
represents the 3-state segment score as a function of the segment length.
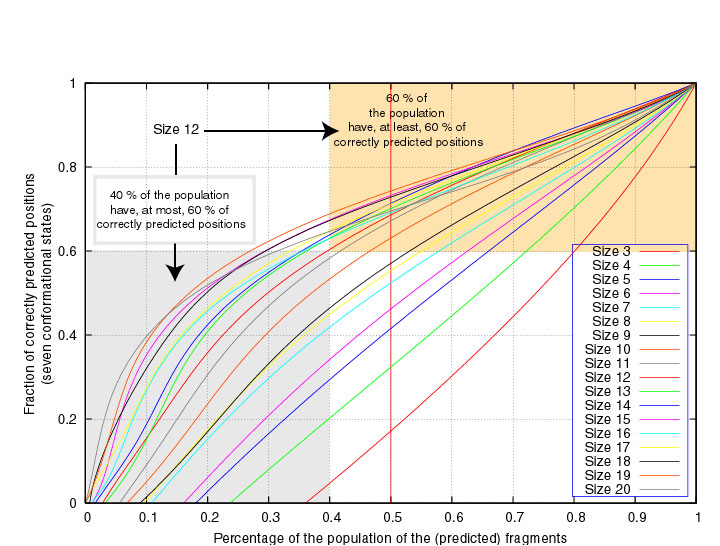
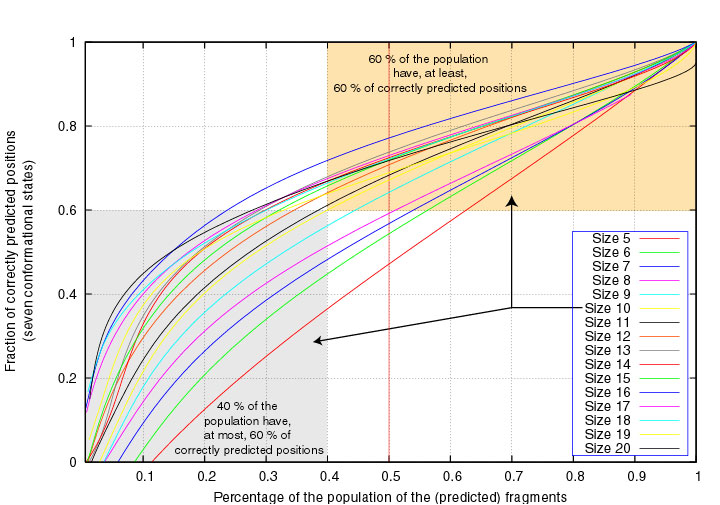
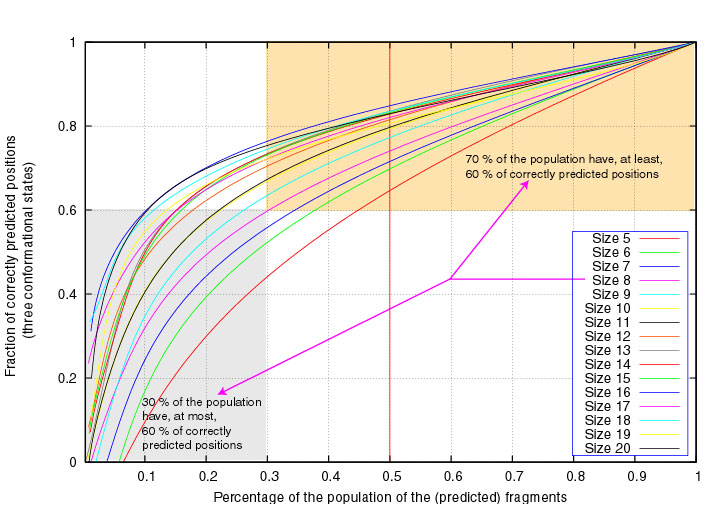
In the next two Figures, the segment scores are given as a function of the
fraction of segments of fixed length that have at least that score,
considering either 3 or 7 structural states.
We see, for example, that 60% of the segments of length 12 have at least 60% correctly
7-state predicted positions :
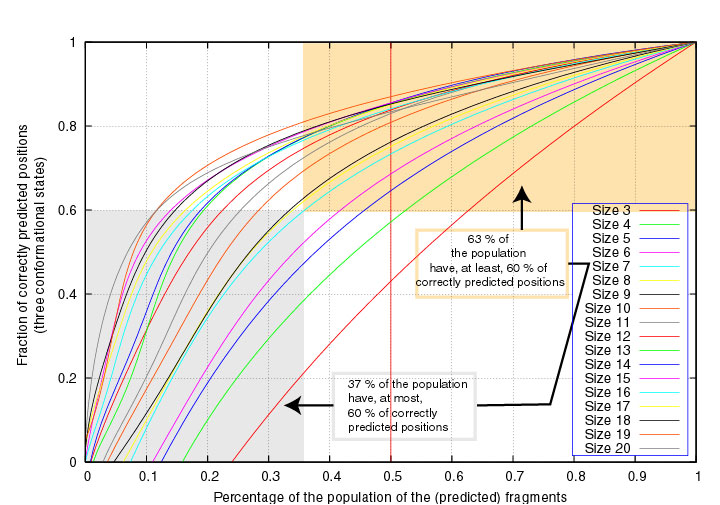
Similarly, 63% of the segments of length 7 have at least 60% correctly
3-state predicted positions :
[
Top,
Prelude&Fugue
]
PERFORMANCES OF Prelude&FUGUE
Position score
Prelude&Fugue was applied to predict the structure of each
protein of the dataset, using the jack knife crossvalidation procedure.
This program leads to a prediction for about 30% of the positions. Among these, the percentage of correctly predicted positions for each of the seven
structural states, as well as the average score, are given in the table
below. The specificities (sometimes called positive predictive values) are defined as the ratio of the number of correctly predicted
states over the number of predicted states, whereas the sensitivities
correspond to the ratio of the number of correctly predicted
states over the number of observed states.
| | | | | |
| | | | | |
|
| 7 states | | | Specificity
| | | Sensitivity | ||
| | 3 states | | | Specificity | | | Sensitivity
|
|
| A | | | 77% | | | 85% | || | | A or C | | | 83% | | | 85% |
| C | | | 36% | | | 26% | || | |
|
| B | | | 66% | | | 67% | || | | B or P | | | 79% | | | 69% |
| P | | | 50% | | | 29% | || | |
|
| G | | | 36% | | | 52% | || | | G or E or O | | | 30% | | | 54% |
| E | | | 24% | | | 65% | || | |
| O | | | 9% | | | 13% | || | |
|
| Average | | | 66% | | | 65% | || | | Average | | | 77% | | | 78% | | | |
|
The scores without distinction between the helical conformations A and C,
between the extended states B and P, and between the other conformations G,
E and O, are also given.
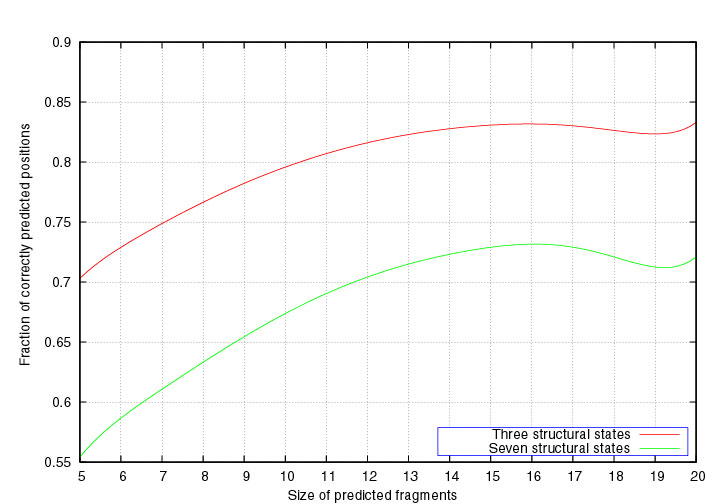
Segment score
The predicted conformations can be divided into segments
corresponding to successions of identical structural states.
The segment score is defined as the fraction of correctly predicted positions
in the
segment. The green curve in the Figure below corresponds to the average segment score as a function of the
segment length. As alpha-helices correspond to successions of A and C states,
and beta-strands to stretches of B and P states, we also define the segment
score for 3 states (A or C), (B or P), or (G or E or O). The red curve
represents the 3-state segment score as a function of the segment length.
In the next two Figures, the segment scores are given as a function of the
fraction of segments of fixed length that have at least that score,
considering either 3 or 7 structural states.
We see, for example, that 60% of the segments of length 10 have at least 60% correctly
7-state predicted positions :
Similarly, 70% of the segments of length 8 have at least 60% correctly
3-state predicted positions :
[
Top,
Prelude&Fugue,
Prelude&Fugue
]